[CabAnon] Anonymity vs Usability, Another shot at Anonymizing the NYC taxi dataset
Rédigé par Félicien Vallet
-
24 septembre 2018Following the Cabanon project, we are republishing an article by Paul Francis, a researcher at the Max Planck Institute for Software Systems, who proposes new methods for working on the New York taxi dataset.
The CabAnon project was launched last year with the objective of exploring if properly anonymized data could still be useful. Our first results showed that exploitable results could already be obtained with a rather coarse but robust approach. Earlier this year we interviewed Paul Francis, who is a research scientist at the Max Planck Institute for Software Systems and co-fouder of the startup Aircloak. He analysed how the Diffix method would fare when facing the challenge of making data from the NYC taxi dataset anonymous though still usable. He presented his approach and results in this blogpost.
We republish him below, with his agreement:
Diffix is a system that is deployed in front of a database containing raw (non-anonymized) data. Diffix intercepts SQL queries made to the database, and anonymizes the answers by placing limitations on the SQL and by adding noise. The database may be a relational database or a NoSQL datastore. This query-by-query approach has two advantages. First, Diffix applies only as much noise as is needed for each query, thus minimizing data distortion. Second, Diffix eliminates the need to manually design an anonymization scheme to fit the use case. In essence, Diffix regards each query as a separate use case, and anonymizes appropriately.
To do its job, Diffix has to be told what to protect. For this analysis, we configured Diffix to protect the privacy of the taxi driver.
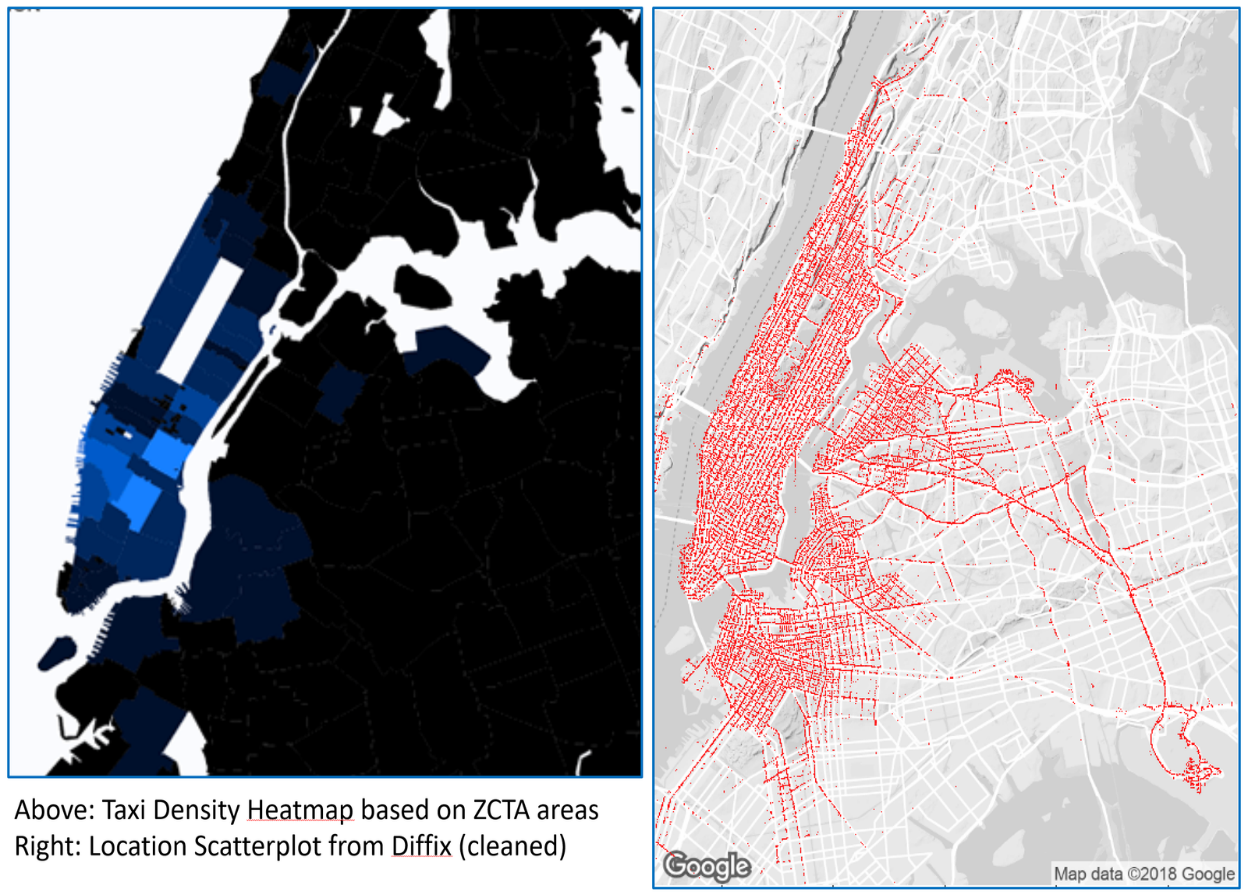
By way of example, consider the scatterplot of taxi pickup locations shown in the figure above. The dots in this image do not represent individual taxi pickups, but rather represent pickups that took place within boxes of approximately 10 meters X 10 meters (granularity of four decimal places in the GPS coordinates). Diffix automatically removed any boxes that did not have enough distinct taxi drivers, the threshold being on average 4 taxi drivers. If we had asked for full granularity, Diffix would have removed more than 90% of the locations.
Because Diffix anonymizes query-by-query, the full set of database attributes are available to us as analysts. There are therefore a wide variety of use cases we could examine simply by writing the appropriate SQL query. In what follows, we select three use case that should give the reader a good sense of what is possible with Diffix.
Use Case 1: Expected Time to LaGuardia Airport
Anybody traveling to LaGuardia to catch a flight needs to know how long it may take to get to the airport. Since taxis frequently travel to the airports, we can answer this question with taxi data..
The following visualizations are scatterplot heatmaps showing the average time to LaGuardia from any location for which enough taxi data exists. We look at three different time periods: the hour from 13:00 to 14:00 on weekends, the hour from 8:00 to 9:00 on weekdays, and the hour from 17:00 to 18:00 on weekdays. These three time periods are chosen to contrast non-rush hour with rush hour, and to contrast the morning rush from the evening rush. In each case, the left-hand figure shows the raw data, and the right-hand figure is for Diffix (labeled Cloak).
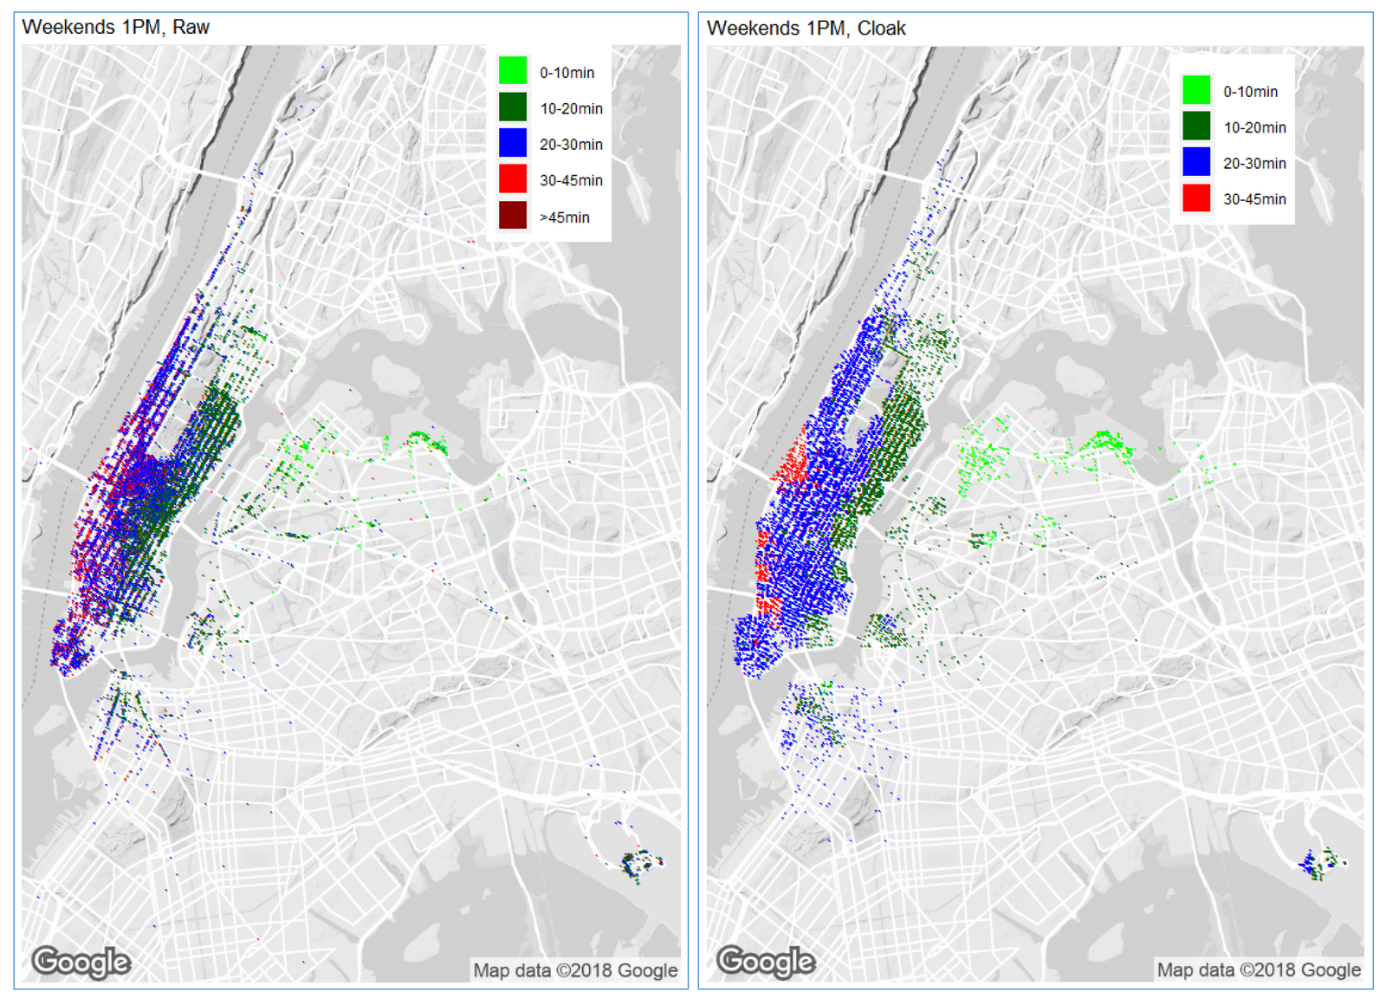
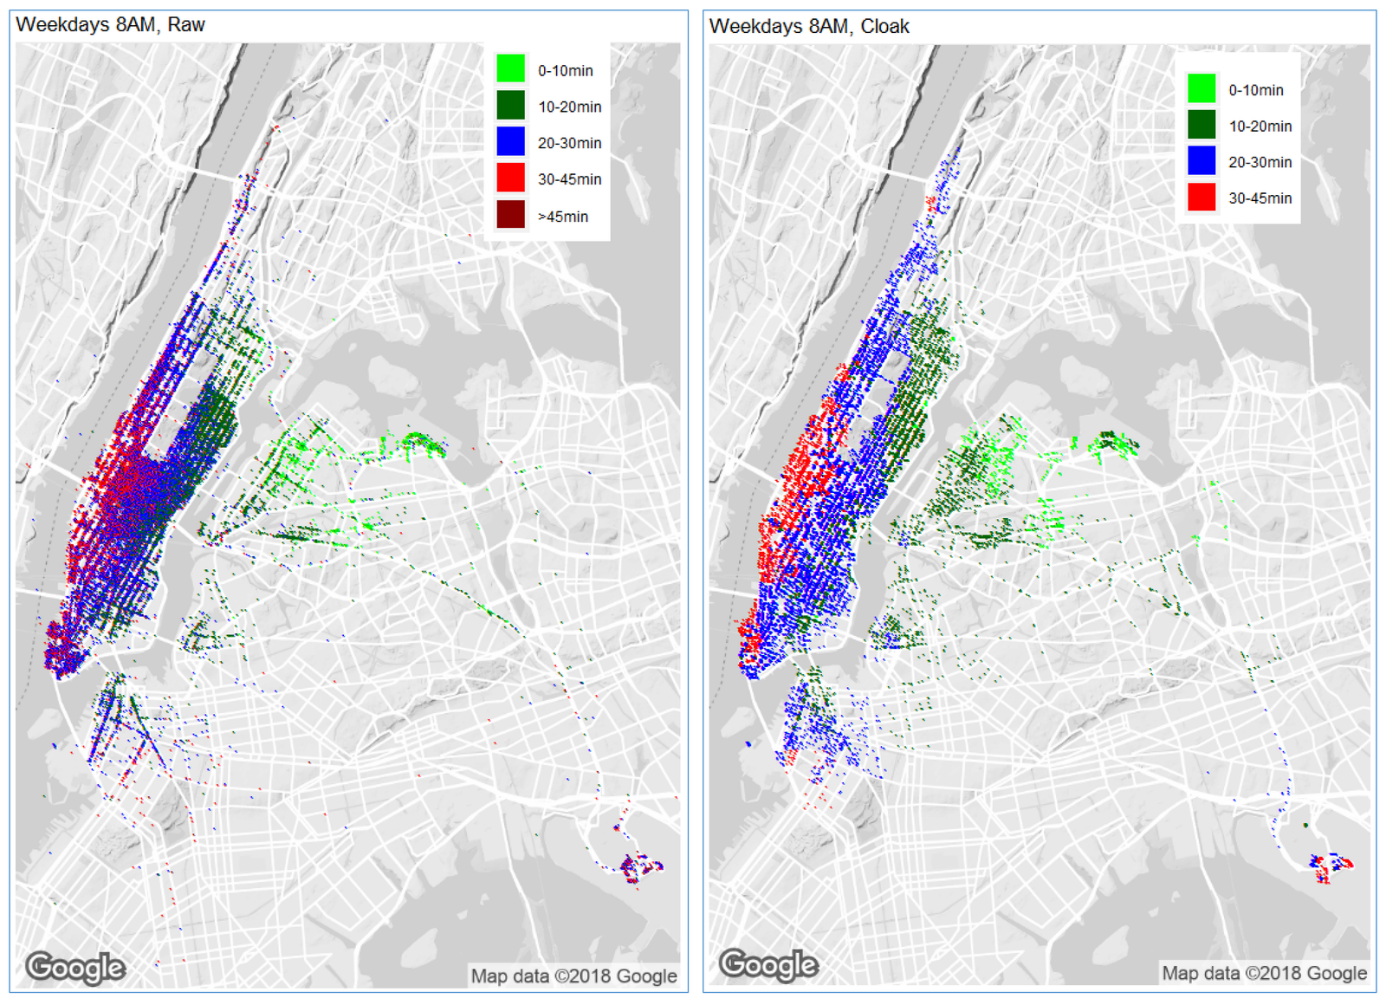
As expected, trip times are longer during weekday morning and evening rush hours as compared to the middle of the day on a weekend. The effect of incoming versus outgoing rush hour traffic for Manhattan is also clear. The cluster of pickup locations on the lower right is JFK airport. Note that the effect of morning versus evening rush is the reverse for traffic from JFK to LaGuardia.
Note in particular that the distortion introduced by Diffix’ anonymization does not change the basic conclusions that may be drawn from the visualizations — the travel time from any area for which data exists is roughly the same for the raw data and the anonymized data.
One item that we found interesting is that there are a lot of rides that start and end at LaGuardia, and that many of these rides fall in the 10–20 minute range. One possible explanations for the short time durations is that travellers in a hurry take a taxi between terminals rather than the shuttle bus. Regarding the longer time durations, perhaps travellers on layover visit some location away from the airport.
Use Case 2: Driver Profiles
Government officials or social scientists might be interested in understanding the work profiles for drivers. While the taxi data identifies the driver, it unfortunately doesn’t carry any other information about drivers (for instance age, duration of employment, number of sick days taken, whether they have health insurance, etc.). Nevertheless, we can learn some interesting things about driver behaviour.
The first question we ask is, how many days per year does each driver work? The following plots that information as a histogram with one data point per day. Note the log scale for number of drivers. A day is counted so long as the driver had at least one pickup during the day. Note that this will over-count drivers who work nights, since one night of work will be counted as two days if the driver starts before midnight.
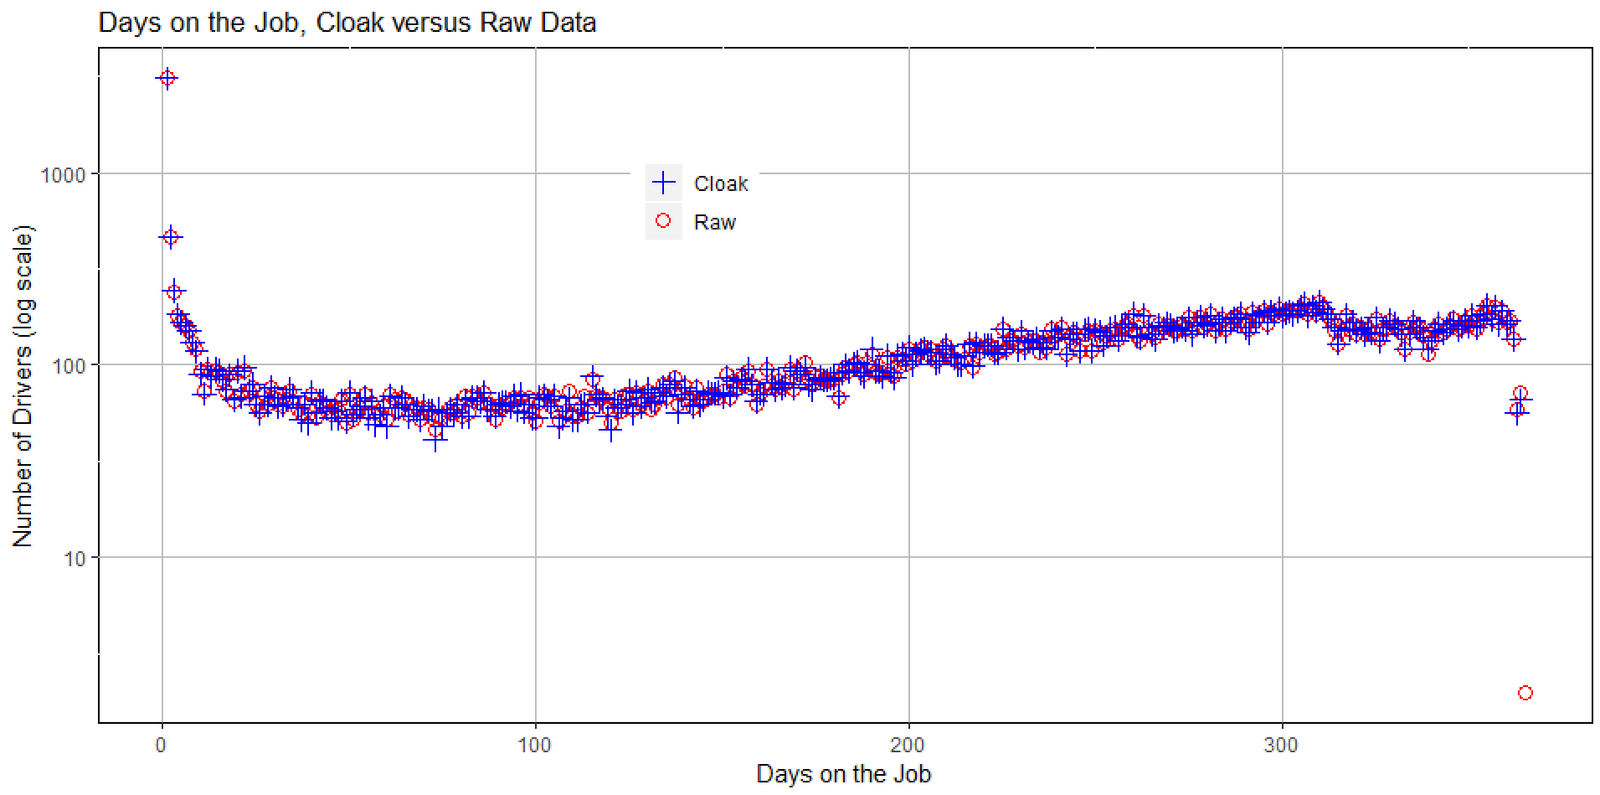
The graphs shows both anonymized (labeled Cloak) and raw data. Note that the anonymized counts are very accurate. Note also that the last raw data point does not have an anonymized counterpart. Diffix suppressed that data point because it refers to too few users, and so could in principle violate anonymity. (As a note of interest, that data point is for two drivers who worked every day of the year!). This graph tells us a number of interesting things. There are a lot of drivers who worked only one or a few days. Over 3000 drivers worked only one day. I would guess that this represents a trial period where either the employee or the employer decided that taxi driver is the wrong job for that person.
The large majority of taxi drivers work on a part-time basis — everything from just a month or two upwards. There could be many reasons for this. Perhaps some drivers work seasonally, drive taxis as a second job, or drive taxis during periods of unemployment.
The next graph shows how many hours per day, on average, each driver works. In particular, we want to see if drivers that work very many days work different hours per day than drivers that don’t work very many days. So that the data clearly distinguishes these two groups, we chose one group as having more than 300 days per year (labeled CloakFull), and the other group as having between 100 and 150 days per year (labeled CloakPart). Here we only show the anonymized data—the raw data is virtually the same (with the exception of a few very hard workers that were suppressed by Diffix).
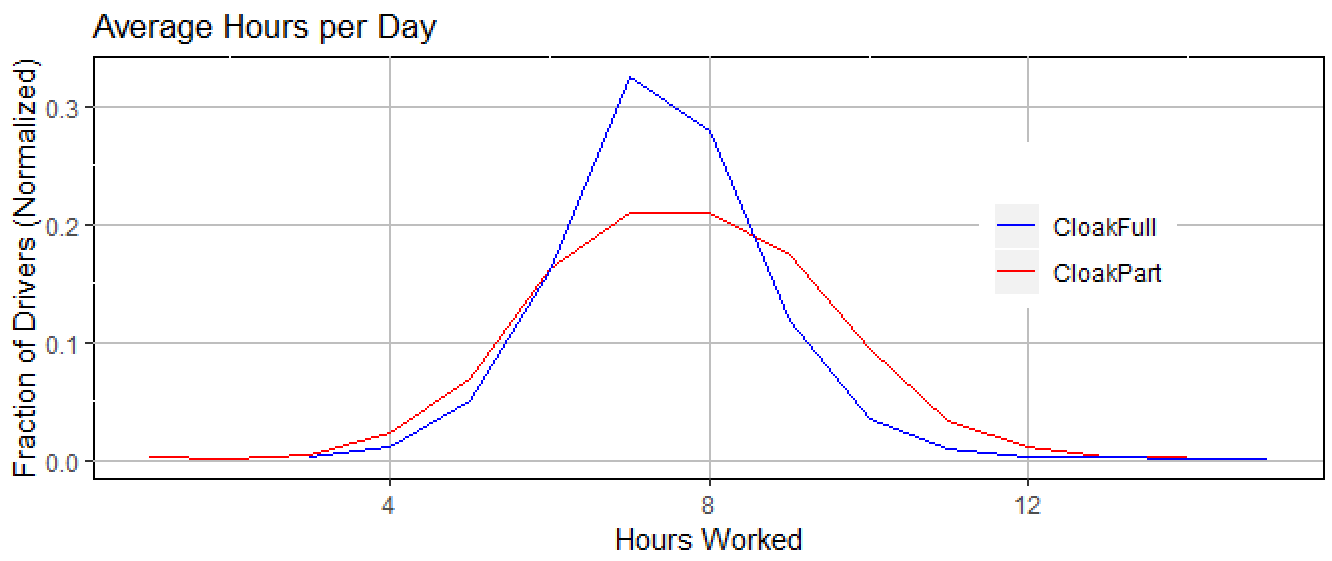
This shows that taxi drivers tend to have normal work times (roughly 6 to 8 hours) whether or not they work few days or many days and that “part-time drivers” tend to have slightly longer work times.
Use Case 3: Traffic Congestion
The taxi data is well suited to studying congestion in the city. This is something that city planners as well as transportation companies are interested in.
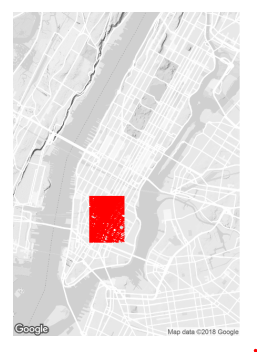
As an example of this kind of study, we queried for the speed in miles-per-hour of all rides where both the pickup and dropoff were within the region denoted by the box above. This represents a large portion of the financial district in Manhattan. (This image is itself created by querying Diffix for pickup and dropoff locations in 10-meter boxes).
The results are shown in the following graph, where speed is computed as distance/time. Starting at midnight, we can see that speed increases through the night until 5AM, suggesting that activity in the city only slowly tapers off through the night (also lending credence to the label as the city that never sleeps).
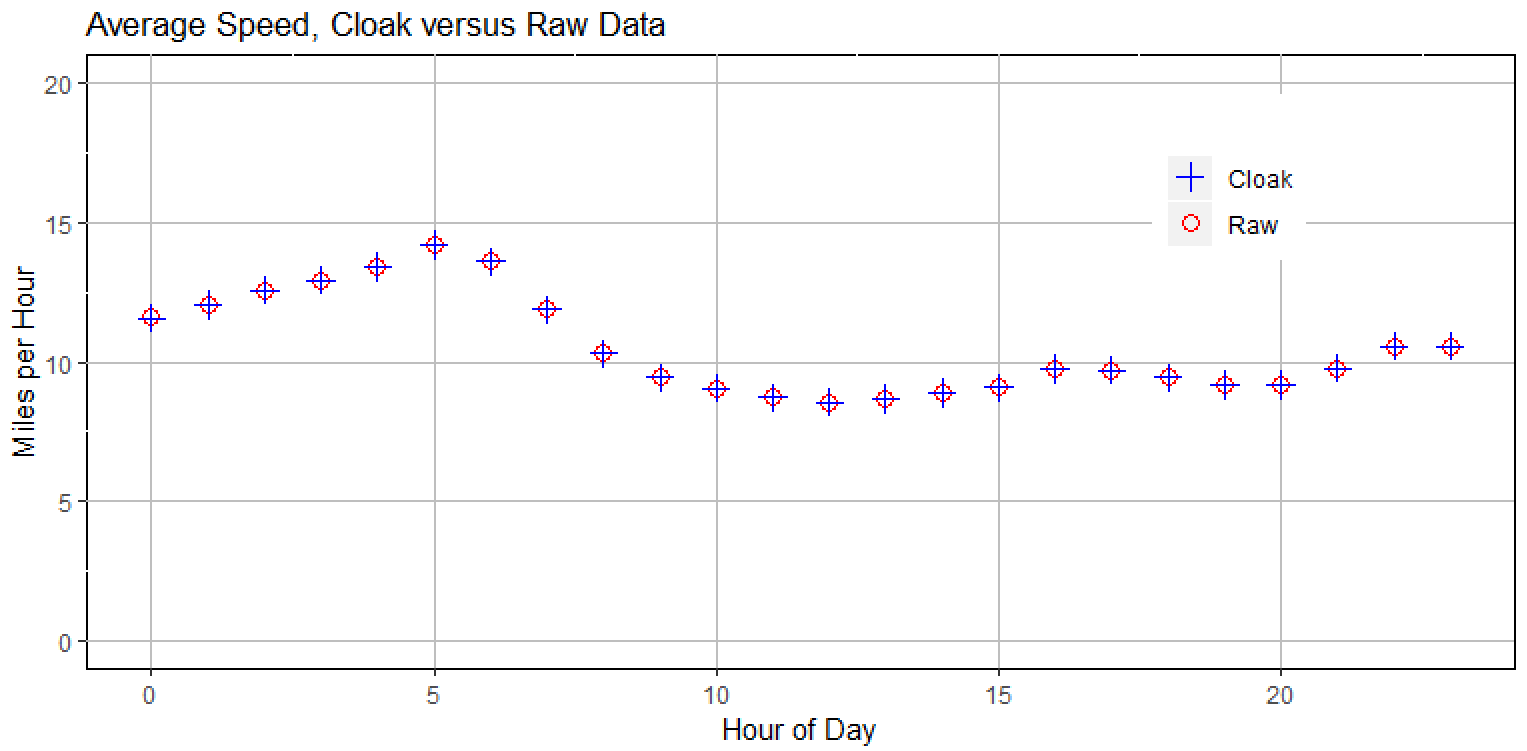
From 5AM, speeds decrease as congestion increases until around 10AM, where the speed stays constant until around 8PM. Interestingly, there are no commuting-time drops in speed, suggesting that people don’t generally commute through the financial district by car. From 8PM, there is a steady increase in speed throughout the night.

Paul Francis
Paul Francis is a scientific director at the Max Planck Institute for Software Systems in Kaiserslautern and Saarbrücken Germany and co-founder of the startup Aircloak. His research focuses on data anonymity.
Illustration : Flickr cc-by-sa Nick Harris