CabAnon: exploring and visualizing anonymized datasets
The Cabanon Project, developed and run by the LINC team, aims at assessing the performance of anonymized datasets and quantifying information loss, using interactive data visualization.
When it comes to personal data protection and privacy, anonymization remains one of the most debated technical concepts. There is no “one size fits all” technical implementation of anonymization, except the complete deletion of the dataset. Often, anonymization must be considered on a case by case basis and companies try to find the right balance between data utility and anonymization.
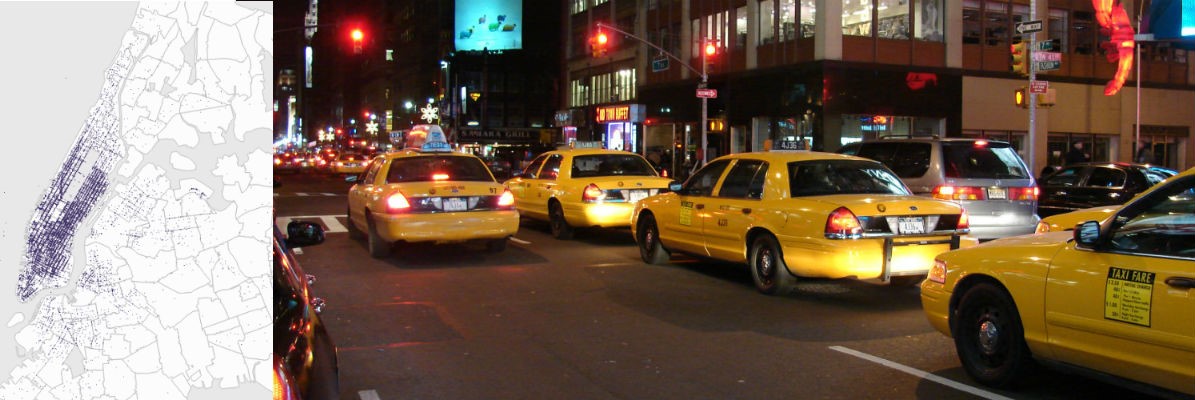
There is a non-proved theory that data is either useful or anonymized, thus suggesting that any anonymized datasets are useless. A non-proved theory needs to be contradicted, this is why we decided to work on real datasets. A few years ago, New York City released records of taxi rides in the city … we downloaded and analysed them, in order to find the balance between utility and anonymization through a concrete example. We did not pick this dataset only because of its relevance for urban development of the Big Apple. Indeed, this dataset raised serious privacy concerns in the past, because data about where and when passengers started their trip, and when and where they arrived, had revealed the identity and whereabouts of famous passengers.
Testing anonymization processes
We have tried to anonymize the dataset in a way that will preserve some of its utility. We did not create the anonymization process from scratch, as we started with Uber’s one. We added some guarantees like k-anonymity (with k =10). It means that we did not consider any trip starting (or finishing) in zones where there was less than 10 trips starting (or arriving) in the same area.
We wanted to see if this dataset could remain useful for urban plans. Thus we looked at different examples of data uses and checked which ones were still relevant with the anonymized data set. Obviously, anonymization means loss of information and therefore, a loss in terms of utility and accuracy, compared to raw data. Our objective was rather to quantify this loss.
From a more technical point of view, this project helps to understand the cost of such anonymization (technical and economic). Indeed, it is based on intensive computation to anonymize and visualize the data. For that, we rely on external resources provided by our partner TeraLab, a big data platform created by Institut Mines-Télécom and GENES (Groupe des Écoles Nationales d'Économie et Statistique).
Using data visualisation
To examine those different challenges, we worked on three datasets: the TLC trip dataset and two anonymised datasets derived from it, each following Uber’s way or the WP29’s guidelines. Those datasets contain geographical data and time data concerning the pickup and drop-off location, the distance travelled, the travel time and the number of passengers.
To compare those datasets, we created a series of data visualizations which offer a way to visually make those data understandable by specialists, urban planners or curious citizens. They can look at the visualisations, observe patterns and get actionable knowledge out of them. This is key to practically show the strengths and limitations of anonymised datasets, and help people understand where anonymization is appropriate and where it is not.
CabAnon features four scenarios exploring how the NYC yellow cabs data could be used for various applications, such as quickly finding a taxi or improving the NYC transport infrastructure. Each of the scenarios (which will lead to a datavisualisation) relies on one parameter which is frequently used to understand and qualify a city’s traffic:
- With the density of the traffic, a taxi user can identify a spot next to him where he is likely to quickly get a taxi.
- With the number of passengers in a taxi, city planners can possibly imagine other solutions to organise mobility.
- With the speed of the traffic, a person can find out when are the best moments to commute, and a city planner can identify places with traffic congestion.
- With the direction of the traffic, a city planner can understand how people are moving through the city and potentially improve public transportation systems.
The results and visualisations give a better understanding of the strengths and weaknesses of anonymization and help to quantify the loss of information on anonymized datasets.
We will publish each visualisation within the first six month of 2017. Be prepared to have a look at them and give your feedback!
Access Right and Right to object
Publié le 10 février 2017
We use the NYC dataset and remove personal data for the purpose of anonymising the dataset. Since we use the dataset, this means that we process personal data. If you took a taxi in New-York city in 2013 and don’t want your data to be processed by us, please contact us. You will just need the reference of the taxi trip and a proof, so that we can remove your data from the dataset.
Send us your request to cabanon(@)cnil.fr with object “OptOut”.