[Eng] GDPR dataviz, making of
Rédigé par Franck Baudot
-
29 août 2016Linc investigates new approaches to data protection for the general public. After studying the data in smartphones with Mobilitics, making cookies visible with CookieViz, Linc looked into the core of Cnil’s activity by designing a datavisualization of the GDPR.

We decided to create a graphical representation of the GDPR in order to shed light on some topics and to identify the links between the various articles. You can see the dataviz here, share and use it through the licence Creative Commons cc-by-nc-sa. This article gives an overview of the steps and tools required for such a work.
The theory…
We used the text that was published by the EU. Its extensive reading allowed to build a .tsv (tab-separated values) file which represents the links between the different articles and recitals.
Python scripts automate the generation of a second .tsv file that contains the following fields:
- Id (the number of the article or recital)
- Label (the name of the article or recital)
- Chapitre (the chapter the article belongs to)
- Color (a colour for the node of the graph)
- Intitulé (the title of the article)
- Texte (the article or recital itself, in html format)
Those files were then imported in gephi, an open source software that allows the generation of graphs from structured datasets.
Then, we had to choose and test different types and forms of visualizations, to find the most ergonomic, esthetical and “readable”. We could have made other choices, as you can see below:
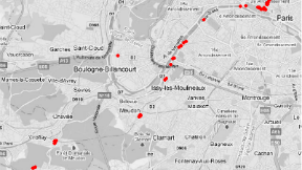
Approche 1
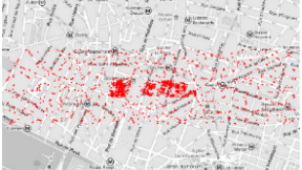
Approche 2
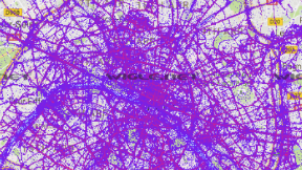
Approche 3
A plugin allows exporting the graph in a form which is publishable on a web server (we used the sigmaJS plugin). Et voilà!
Ok, that was the simple and theoretical version.
… and the reality
Now, the complete story : convert pdf to plain text, remove footers and headers with a macro of a text editor, create the .tsv file with the python script, clean up any formatting not managed by the script, configure Gephi with the relevant plugins, create the graph from the .tsv files, clean up again incorrectly formatted fields, choose a layout, arrange the nodes by chapters while keeping a good visibility, export the graph with the proper plugin, and finally adapt some JavaScript files for customisation …
We take the opportunity of this article to give credits to the developers of Gephi, SigmaJS and the plugin.
It is time for you to navigate in the dataviz to apprehend what is at stake for personal data, or maybe would you prefer propose new tools for a better understanding of the topic?
Find the source code on GitHub